We updated the article in 2026 - we went through the text, links and illustrative images.
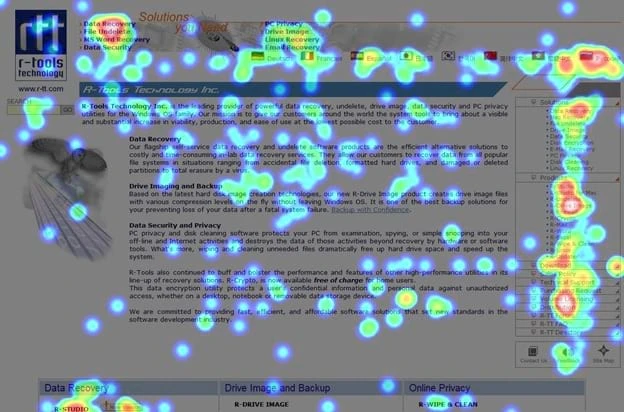
One of the ways to improve the efficiency of your website or service is the so-called heatmaps. It's an analytics tool that shows you where user activity is concentrated on your website. The result is a map that distinguishes the most frequently „clicked“ locations and shows you where your client moves their mouse or finger on their device's display. Heatmaps have several advantages and in our next blog we will show you how you can use them to build a more effective website.
Know the behavior of your customers
A basic prerequisite for building an effective website is knowing the behavior of your clients. You need to find out how they think, how they behave and what they do when they open your website. While you can track some of the activities using Google Analytics (and, for example, UTM links), a more effective tool is heatmap. It will show you which places on your website people visit most often.
An example of a heatmap on the Guardian website.
Based on the heatmap, you can find out whether your client really clicks on the menu that you painstakingly prepared for several weeks, or whether he goes automatically to one of the subsections of the page. And adjust the layout of your controls accordingly. The heatmap will also reveal that you should get rid of some elements on your website. If clients don't even hover over them, no one will click on them, so they may be useless for the website.
Important elements in red
The heatmap uses shades of green, through yellow to red, which points to the places where the visitor's cursor goes astray most often. It is in them that you should place important control elements – buttons for shopping, payment, order, or contact, as long as you are not selling anything and only looking for potential clients. Change the layout of the web elements so that it is most important in the places where your customers naturally click most often.
These changes will not only have a positive effect on your financial status – the clients themselves will also be pleased. In order to take important steps in the purchase process, they have to make fewer mouse movements and fewer clicks, which suits them best. The layout of the control elements based on the heatmap is thus a win-win situation for you and your clients.
In addition, you can also use heatmaps to change the position for ads, online forms, CTA buttons, whether references in the text.
What types of heatmaps do we know?
We distinguish several types of heatmaps. They are divided according to what type of customer actions they measure and what parameters they use.
- Scroll map – It shows to which level the clients scrolled with the mouse, or to which level they went with their cursor. That way, you will know where it is appropriate to place the CTA button, for example, in a blog or on the home page.
- Confetti (click) map – It is a more advanced version of the classic heatmap. It shows individual clicks by website visitors, even on elements that are not „clickable“. You can then remove them to reduce the bounce rate from your website.
- Overlay map – It shows the percentage of clicks on individual elements of your website.
- Hover map – It shows mouse movement across your site, not individual clicks. In some cases, this type of map is more convenient because some elements can only be displayed as a „hover“ (image preview, menu…).
- Attention maps – These maps bring another dimension to analytics – time. When displaying color, heatmaps take into account not only which element of the website the client moved the cursor to, but also how long he spent on it.
Can heatmap be tried for free?
Like any other online solution, heatmaps are available in a trial version, in a trial period or as free solutions with or without limitations. The most popular solutions include heatmaps:
V prípade záujmu o implementáciu heatmapy alebo iného nástroja na sledovanie aktivity vašich používateľov na váš web nás neváhajte kontaktovať. Radi vám pomôžeme s ich inštaláciou, nastavením a obsluhou. Ďalšie články týkajúce sa e-commerce segmentu a marketingu nájdete v sekcii blog.